
IELTS Academic Writing Task 1 Strategy and Tips
The IELTS Academic Writing Task 1, you have to base your answer on an infographic, such as a chart, map, or table, and summarise and report on key information like the similarities and differences in data. You should write at least 150 words in this part of the task. The key is excellent preparation. With our guide to IELTS Writing Task 1, you will be prepared to write a report worth 7 scores or more!
With the help of this blog let us understand the different infographics, how to describe them, strategy to write the report, corresponding vocabulary, tips & techniques, and samples.
Table
What is a Table?
The rows (horizontal) and columns (vertical) represent one particular kind of data respectively. What this data is, is indicated in the top row and first column, based on which you can interpret the data in each box.
Strategy for Report on Table
Step 1: Identify what the table is about.
-
Read the question carefully.
-
Identify the 2 main types of data and the unit of measurement.
Step 2: Understand the data.
-
What information is given in each box?
-
Identify the patterns, including similarities, differences, and changes over time.
Step 3: Start writing, based on the following structure.
-
Introduction: what the bar graph is about, including the categories of data, the units of measurement, etc.
-
Key features: the data given in each box. You can group this information column-wise or row-wise. Complete one row/column at a time.
-
Overview: based on what you have written so far, write about the main patterns.
Key Tips
-
Write between 150-200 words.
-
Do not write a conclusion wherein you will repeat any information – this is unnecessary.
-
Do not make inferences about what the table may be saying about the topic. Stick to reporting the data.
-
In most cases, the data will relate to something in the past. Use the past tense throughout your report.
Important Vocabulary
Using the correct jargon is essential for high scores. You will use these words to describe a table in IELTS writing:
-
To describe changes
|
Up Verbs |
Down Verbs |
|
Rise Grow Incline Increase |
Fall Diminish Decline Decrease |
|
Small |
Big |
Same/No change |
Approximation |
|
High Gradual Slow Minute Slight Negligible |
Low Rapid Drastic Exponential Tremendous Considerable Significant Marked Steady Sharp |
Constant Steady Uniform Moderate Exact |
Just above Just below A little more than A little less than In between |
-
To make comparisons, identify similarities and differences
|
Lower than |
Higher than |
Same/Different |
|
Less than Under |
More than Over Double/Triple Peak |
Equal Similar Equitable Different Distinct |
-
Linking words – to link together different sentences/ideas/types of data
|
However On the other hand In contrast Alternatively While / Whereas Although Other than Otherwise Similarly In addition At the same time Concurrently |
Sample Report on Table
The table below shows the number of boys and girls enrolled in different levels of school over a period of time.
Summarize the information given by identifying and reporting the main features, and making comparisons where relevant.
Unit: in thousands
|
|
1970-1979 |
1980-1989 |
1990-1999 |
|
Boys enrolled in primary school |
15 |
23 |
34 |
|
Girls enrolled in primary school |
13.5 |
22.1 |
33 |
|
Boys enrolled in middle school |
14 |
21 |
32 |
|
Girls enrolled in middle school |
13 |
19 |
29 |
|
Boys enrolled in secondary school |
10 |
20 |
30 |
|
Girls enrolled in secondary school |
5 |
15 |
28 |
The table indicates boys’ and girls’ enrolment in primary, middle and secondary school, over three time periods, i.e. 1970-79, 1980-89, and 1990-99. The data is measured in units of thousands.
In the period from 1970-79, 15,000 boys were enrolled in primary school, 14,000 in middle, and 10,000 in secondary school. In the same period, 13,500 girls were enrolled in primary, 13,000 in middle, and 5,000 in secondary school.
From 1980-89, boys’ enrolment stood at 23,000 in primary school, 21,000 in middle, and 20,000 in secondary school; while girls’ enrolment stood at 22,100 in primary, 19,000 in middle, and 15,000 in secondary school.
Between 1990-99, 34,000 boys were enrolled in primary school, 32,000 in middle and 30,000 in secondary school; while girls’ enrolment stood at 33,000 in primary, 29,000 in middle, and 28,000 in secondary.
The data indicates an increase in enrolment for both boys and girls at all three levels of schooling, over time. The sharpest incline in enrolment was among girls at the secondary school level. Enrolment of both boys and girls was highest at primary school level and lowest at secondary school, throughout. Overall, boys’ school enrolment was higher than girls’ enrolment.
Map
What is a Map?
The map will represent a place, usually a small area like a town. It will give information about that place using a colour scheme, small icons, etc. In many cases, you will be given multiple maps showing changes over time, differences between 2 places, etc.
Example:

Source: created by Hurray
Strategy for Report on Map
Step 1: Read carefully and understand the map.
- Read the question and identify what kind of information about the place is given.
- Identify the way this information is represented, such as through 2 maps of the same place.
- Identify the main patterns i.e. similarities, differences, and high/low comparisons.
Step 2: Start writing, based on the following structure.
- Introduction: what is the main information represented in the map.
- Key features: summarise the main information. Make sure to categorise based on logical links.
- Overview: based on what you have written, write about the main patterns.
Key Tips
- Write between 150-200 words.
- Do not write a conclusion or make inferences that aren’t visible on the map.
- You must have basic knowledge of how maps work – including the 4 cardinal directions, the kinds of icons used to represent ponds, bridges, roads, rivers, etc.
Important Vocabulary
When it comes to the IELTS Writing Task 1 Map, knowing the right kind of jargon to use can help you achieve the band score you desire!
Language of Location: to describe the location of items on the map.
|
At the top / At the bottom On the left / On the right Left-hand side / Right-hand side South / North / East / West Southeast / Southwest / Northeast / Northwest To the north / To the south / To the east / To the west Opposite / In front of / Behind In the middle / In the centre Above / Below Inside / Outside Just beyond / A little beyond / Just past Next to / Alongside / Adjoining |
Life Cycle
What is a Life Cycle?
You’ll be given a diagram of a natural process, like the life cycle of an organism from birth to death. The different stages and processes will be labeled.
Example:

Source: Wikimedia Commons
Strategy for Report on Life Cycle
Step 1: Examine the diagram carefully.
- Identify the organism and understand each stage.
- Examine the parts of the diagram that are not labeled, for relevant information.
Step 2: Start writing, based on the following structure.
- Introduction and Overview: identify the organism and talk about how the diagram is representing the process of its development, from the first to final stage.
- Key features: describe the process stage by stage – include all relevant details, and do not leave out information that is not labeled.
Key Tips
- Write between 150-200 words.
- Do not write a conclusion or make inferences that aren’t visible on the map.
- Write in paragraphs. Do not use bullet points.
Vocabulary for Report on Life Cycle
When describing a life cycle, there’s plenty of useful words and phrases you can use to explain the various stages. These will help you earn top scores.
1. Use phrases that indicate the number and order of stages:
|
Firstly Secondly After that Next Then Finally |
2. Use adjectives and adverbs to describe stages in the life cycle. These adjectives will not appear in the diagram, and you will be expected to use your own.
e.g. The tiny eggs develop into fish-like tadpoles that swim speedily.
Bar Graph
The most common type of infographic is the Bar Graph.
What is a Bar Graph?
In a bar graph, numerical data is represented using vertical or horizontal bars. When you look at the bar graph it is easy to make comparisons and understand the data.
Example:

In the bar graph, there will be 2 axes to indicate 2 different categories of data. Each bar shows how the 2 types of data come together.
How to Write Report on Bar Graph?
Use the following strategy:
Step 1: Identify the Axes
You have to understand what are the main categories of data.
Step 2: Identify Key Features
The key features come from the bars and the data. Look for similarities, differences over time, patterns or trends, highs, and lows, etc.
Step 3: Write the Overview
The first part of the task involves simply reporting what the data is telling you.
- Start with a brief introduction on what the bar graph is about: including the categories of data, the units of measurement, etc.
- Highlight all the key features.
Step 4: Final comparison
In the end, based on the data identified, identify the main broad patterns – the changes over time, the differences between two categories, and so on.
Important Vocabulary for Report on Bar Graph
For each part of your report, you must use certain terms to accurately present the data.
- Introduction
|
What the Bar Graph is doing |
What is the Bar Graph showing |
|
|
Demonstrates Indicates Represents Shows Measures |
Data Figures Number Time period |
|
- Overview and Comparison
|
Verbs: Up |
Verbs: Down |
Comparison: Low |
Comparison: High |
Comparison: Same/Different |
|
Rise Grow Incline Increase
|
Fall Diminish Decline Decrease |
Just below Less than Under
|
Just above More than Over Nearly Double/Triple |
Equal Similar Equitable Different Distinction |
Descriptive words
|
Small change |
Big change |
Same/No change |
|
High Gradual Slow Minute Slight Negligible
|
Low Rapid Drastic Exponential Tremendous Considerable Significant Marked |
Constant Steady Uniform Moderate Exact
|
Linking words
|
On the other hand In contrast While Similarly
|
Sample Report on Bar Graph
Here is how you will write a report on the bar graph in IELTS. Some of the key terms are highlighted for you.
The chart below gives details of students’ enrolment in sports activities in a public school.
Summarize the information by selecting and reporting the main features, and make comparisons where relevant.

The bar chart indicates the number of boys and girls enrolled in sports activities in a public school, over 3 time periods approximately 20 years apart, i.e. the years 1960-61, 1980-1981, and 2000-2001. The data is measured in units of tens.
In the period from 1960-61, less than 30 girls and more than 50 boys were enrolled in sports activities. In the 1980-81 period, the number of girls enrolled in sports activities rises exponentially to nearly 50. On the other hand, there is a moderate rise in boys’ enrolment, to just over 60. Finally, in the period from 2000-01, the numbers of girls and boys enrolled in sports activities shows a slight incline to just over 50 and under 70 respectively.
Based on this chart, a comparison can be made between boys' and girls’ enrolment in sports activities over time. For both genders, sports enrolment continues to rise over time, but at different rates. The girls’ enrolment in sports was very low in 1960-61 but shows a marked increase over time; while the boys’ enrolment started out high in 1960-61, and continued to increase over time, but at a lesser rate than the girls. By the 2000-01 period, the difference between the number of boys and girls enrolled in sports activities is much less, compared to both the 1960-61 and the 1980-81 periods.
Line Graph
What is a Line Graph?
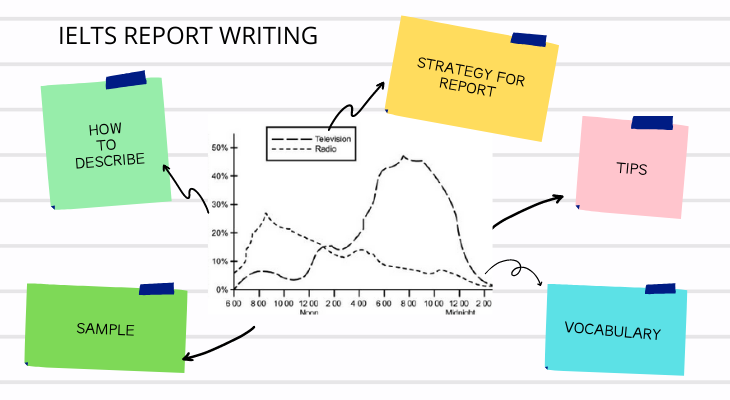
In a line graph, numerical data is represented using horizontal lines. Each variable (the main things the graph is about) is matched with a line. Each line curves high and low depending on the data value. Thus, when you look at the line graph it is easy to make comparisons and understand the data.
Example:

Source: IELTS.org
Strategy for Report on Line Graph
Step 1: Identify what the graph is about.
- Read the question carefully.
- Identify the 2 main types of data – these will be indicated on the 2 axes.
- Identify the line scheme – which line for which variable.
- Identify the unit of measurement.
Step 2: Understand the data.
- Trace each line as it rises, peaks, and falls.
- Identify the patterns, including similarities, differences, and changes over time.
Step 3: Start writing, based on the following structure.
- Introduction: what the line graph is about, including the categories of data, line scheme, etc.
- Key features: describe the data, one variable at a time.
- Overview: based on what you have written so far, write about the main patterns.
Key Tips
- Write between 150-200 words.
- Do not write a conclusion or interpret the data.
- To avoid confusion about the data, trace the lines carefully with your finger/mouse pointer.
Important Vocabulary
To describe a line graph in IELTS writing, using the right jargon is half the battle! Here’s what you need to know:
- To describe changes
|
Up Verbs |
Down Verbs |
|
Rise Grow Incline Increase |
Fall Diminish Decline Decrease |
|
Small |
Big |
Same/No change |
Approximation |
|
High Gradual Slow Minute Slight Negligible
|
Low Rapid Drastic Exponential Tremendous Considerable Significant Marked Steady Sharp |
Constant Steady Uniform Moderate Exact
|
Just above Just below A little more than A little less than In between |
- To make comparisons, identify similarities and differences
|
Lower than |
Higher than |
Same/Different |
|
Less than Under
|
More than Over Double/Triple Peak |
Equal Similar Equitable Different Distinct |
- Linking words – to link together different sentences/ideas/types of data
|
However On the other hand In contrast Alternatively While / Whereas Although Other than Otherwise Similarly In addition At the same time Concurrently |
Flow Chart
What is a Flow Chart?
A flow chart is a diagrammatic representation of the workflow of a process. It consists of boxes and arrows to show the various stages in a process.
Example:

Source: Wikimedia Commons
Strategy for Report on Flow Chart
Step 1: Read and understand the flow chart.
- Read the question and identify the process.
- Identify the stages in the process.
- Identify the end result.
Step 2: Start writing, based on the following structure.
- Introduction and Overview: describe the process and how it is designed to reach a particular end result.
- Key features: summarise the stages in the process. Start from the first and systematically go from one to the next. If there are any divisions, complete one full section, before going to the next.
Key Tips
- Write between 150-200 words.
- Do not write a conclusion or make inferences that aren’t visible in the flow chart.
- Be systematic in your writing – while this is an easy task to perform, you could lose points if you do not organise your writing. Give yourself time to properly examine the flow chart before writing.
Important Vocabulary
These are the jargons you can use for the IELTS Writing Task 1 Flow Chart – they help to organise the information systematically.
Linking words: Use these words to describe how the different stages are linked together.
|
First of all To begin with And then After that Next Finally Alternatively otherwise In addition At the same time Concurrently |
Building Plan
About Building Plan
This diagram may look similar to a map but there are a few key differences.
You will be given an image of a building complex, a single floor space, etc. as it looks in the present. You will also be given another image of the same area, but with changes proposed for a future time.
Your task will be to write a report on the building plan, with an emphasis on the proposed changes.
Strategy for Report on Building Plan
Step 1: Read carefully and understand the building plan.
- Read the question and identify what kind of building plan it is.
- Examine the two-floor plans, and identify the key changes in the second.
Step 2: Start writing, based on the following structure.
- Introduction: what kind of building plan it is, and the time frame involved.
- Key features: describe the first plan, followed by the second. For each plan, write about the location of different elements.
- Overview: Comment on the major changes. e.g. “The proposed changes include increasing the space for the classrooms, reducing the width of the corridor, and adding a new auditorium hall.”
Key Tips
- Write between 150-200 words.
- Do not write a conclusion or make inferences that aren’t visible in the building plan.
- When examining the floor plans, compare the 2 section by section, so that you don’t miss out any changes.
Important Vocabulary
Knowing the right words to use is key to acing IELTS Writing Task 1 Building Plan.
- Describing Changes
|
Type of Change |
What is Changed |
|
Modify No longer Move to the middle/side Remove Add Replace Increase Reduce Shift |
Area Size Space Length Breadth/Width Height At the entry In the front Around the back Across the hall On the left/right side Tree coverage |
2) Language of Location: to describe the location of items on the building plan.
|
At the top / At the bottom On the left / On the right Left-hand side / Right-hand side Opposite / In front of / Behind In the middle / In the centre Above / Below Inside / Outside Just beyond / A little beyond / Just past Next to / Alongside / Adjoining |
Process Diagram
What is a Process Diagram?
This is the representation of a process in diagram form – it is usually a man-made process, such as the manufacturing of some product.
All the stages of a process will be drawn and labeled, and linked together using arrows. You will write your report describing this process.
Example:

Source: IELTS.org
Strategy for Report on Process Diagram
Step 1: Read and understand the flow chart.
- Read the question and identify the process.
- Identify the stages in the process.
- Identify the end result.
Step 2: Start writing, based on the following structure.
- Introduction and Overview: describe the process and how it is designed to reach a particular end result.
- Key features: summarise the stages in the process. Start from the first and systematically go from one to the next. Use the drawing as well as the labels to describe each stage.
Key Tips
- Write between 150-200 words.
- Do not write a conclusion or make inferences that aren’t visible in the flow chart.
- Be observant – examine all the elements of the diagram to ensure that you cover all the information.
- Be systematic – follow the direction of the arrows.
Important Vocabulary
To help you organise your writing and gain a score of 7 or higher, there are some important words that help.
Linking words: Use these words to describe how the different stages are linked together.
|
First of all To begin with And then After that Next Finally Alternatively otherwise In addition At the same time Concurrently |
Read 5 Tips for Summarizing Diagram
Pie Chart
What is a Pie Chart?
A pie chart is a representation of data that shows how different variables comprise the whole. e.g. in the pie chart below, the variables are the areas of expenditure and the whole is the entire government expenditure.
Each part of a pie chart, denoted by a particular colour, shows the share of one variable (the main element). The data may be further represented using percentages, numerical values, weight, distance, etc.
You may be given 2 different pie charts and asked to make a comparison.
Example:

Source: created by Hurray
Strategy for Report on Pie Chart
Step 1: Identify what the chart is about.
- Read the question carefully.
- Identify the variables, the colour scheme, and the unit of measurement.
Step 2: Understand the data.
- Match each variable to the data.
- Make comparisons i.e. higher/lower share, similarities and differences etc. If there are 2 pie charts, make comparisons between the two.
Step 3: Start writing, based on the following structure.
- Introduction: what the pie chart is about, including the variables, colour scheme, etc.
- Key features: describe the data, one variable at a time. If there are two pie charts, describe each one at a time.
- Overview: write about the comparisons you have made.
Key Tips
- Write between 150-200 words.
- Do not write a conclusion or try to interpret the data further.
Important Vocabulary
When learning how to describe a pie chart in IELTS learning, don’t forget to learn the right jargon to make your report precise and organised.
- To make comparisons, identify similarities and differences
|
Lower than |
Higher than |
Same/Different |
|
Less than Under
|
More than Over Double/Triple Peak |
Equal Similar Equitable Different Distinct |
|
Small |
Big |
Same/No change |
Approximation |
|
High Gradual Slow Minute Slight Negligible |
Low Rapid Drastic Exponential Tremendous Considerable Significant Marked Steady Sharp |
Constant Steady Uniform Moderate Exact |
Just above Just below A little more than A little less than In between |
- Linking words – to link together different sentences/ideas/types of data
|
However On the other hand In contrast Alternatively While / Whereas Although Other than Otherwise Similarly In addition At the same time Concurrently |
Did you find this information on how to describe a pie chart in IELTS Writing useful? To know more about it join our IELTS Online or IELTS Classroom Training. Reach out to us at info@hurrayedutech.com or call us at 9900426501.
Hurray offers Study Abroad consultation, IELTS/PTE/OET programs. Visit our website https://www.hurrayedutech.com/ for more information.


Comments
No comments yet. Be the first to comment!